Analysis
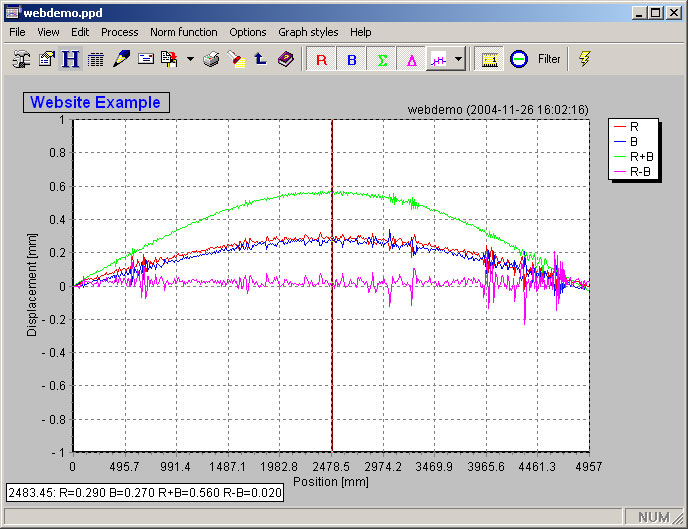
The analysis part of the program may well be the part where you will spend the most time. Here you may decide what to view, e.g. the result of the Red sensor or the Blue or Red+Blue or Red-Blue.
You may also decide how to view it, zooming in on parts of the measurements to study some part of the measurement in detail.
And it wouldn’t merit to be called ‘analysis’ part unless it came with analysis tools. But it does: a low-pass filter (with selectable filter length), norm subtraction both cosine and linear (any number of segments can be defined), top measurement processing.
And then we have the ‘waterfall’ mode, where several measurement results can be displayed together in a 3D view, to study, for example, how a roller changes with time. It would require many more words to describe all the features in detail and it has already been done: in the extensive help supplied with Profile3T.
Want to see the graph in more detail? If so, click the image.