Reporting
To a user, the most important bit of a measurement tend to be the reporting. Of course, measuring properly and accurately is also important but without a report there isn’t much to show, no matter how good the measurement.
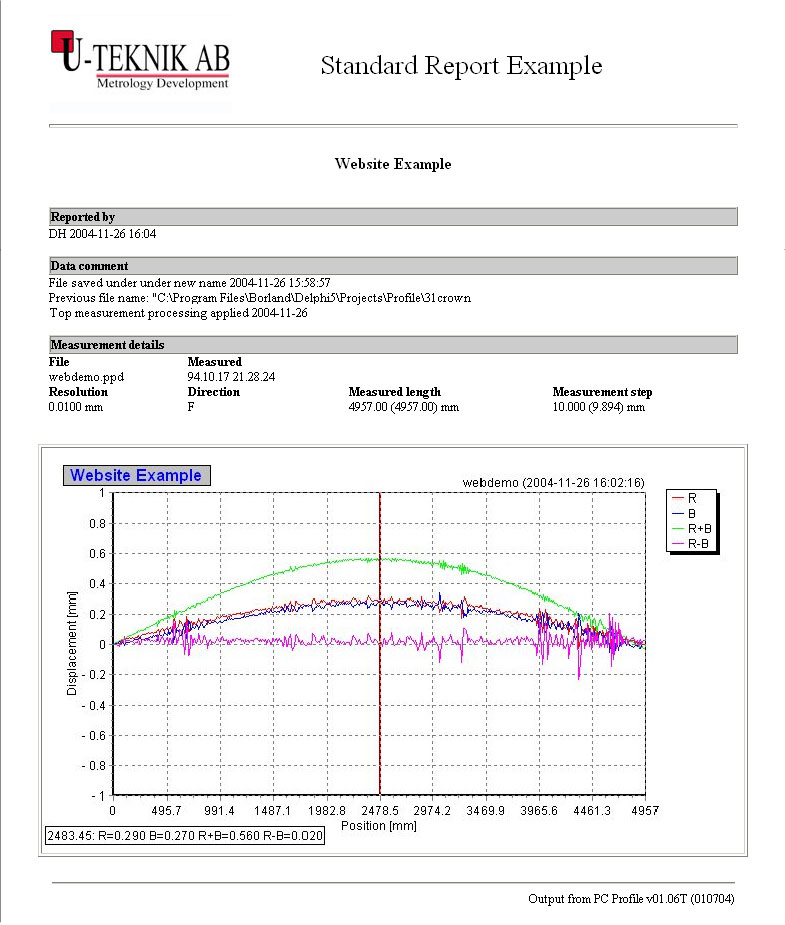
To aid in this, PC Profile defines what is calls “The Standard Report”. This report consists of a header area containing the conditions under which the measurement was made, such as measurement sensitivity and measurement interval. This aids in what is called ‘traceability’.
Below the header is the graph as it looks after any desired processing has been applied. However, it may well be the raw data, it all depends on what the report is supposed to show.
Many aspects of the the report can be customised, e.g. the report title, a company logo, the size of the graph. Reports can be saved in many diffrent formats, PDF, html, Excel and more.
Want to see the report in more detail? If so, click the image.